-3.png?width=350&height=61&name=RetailMetrixLogo%20(1)-3.png)

As a retailer, keeping track of metrics to understand the performance of your business and identify areas for improvement is both essential and challenging. With so many metrics to choose from, it is important to narrow the focus down for a while and prioritize the most important standards in line with industry-best practices. In this blog, we will discuss five key metrics that we think every retailer should track to boost sales.
1. Conversion rate (CR): Conversion rate is particularly important for online retailers to effectively convert website visitors into consumers. CR is the percentage of website visitors who make a purchase. According to a study by Monetate, the average conversion rate for e-commerce websites is 2.86%. However, the top 25% of websites have a conversion rate of 5.31% or higher.
What does it mean for your business: A low conversion rate could indicate issues that the website needs work with - it can range from web design to product pricing and complicated checkout process. Tracking your conversion rate can help the online retailers identify the obstacles to their online consumer base, focus on improving it and in turn building a stronger online business.
2. Average order value (AOV): AOV is the average amount of money a customer spends per order so it completely focuses on boosting sales for the company to increase overall revenue. A study by Shopify shows that the average AOV for e-commerce orders is $72. However, the top 10% of stores have an AOV of $212 or higher.
2. Average order value (AOV): AOV is the average amount of money a customer spends per order so it completely focuses on boosting sales for the company to increase overall revenue. A study by Shopify shows that the average AOV for e-commerce orders is $72. However, the top 10% of stores have an AOV of $212 or higher.
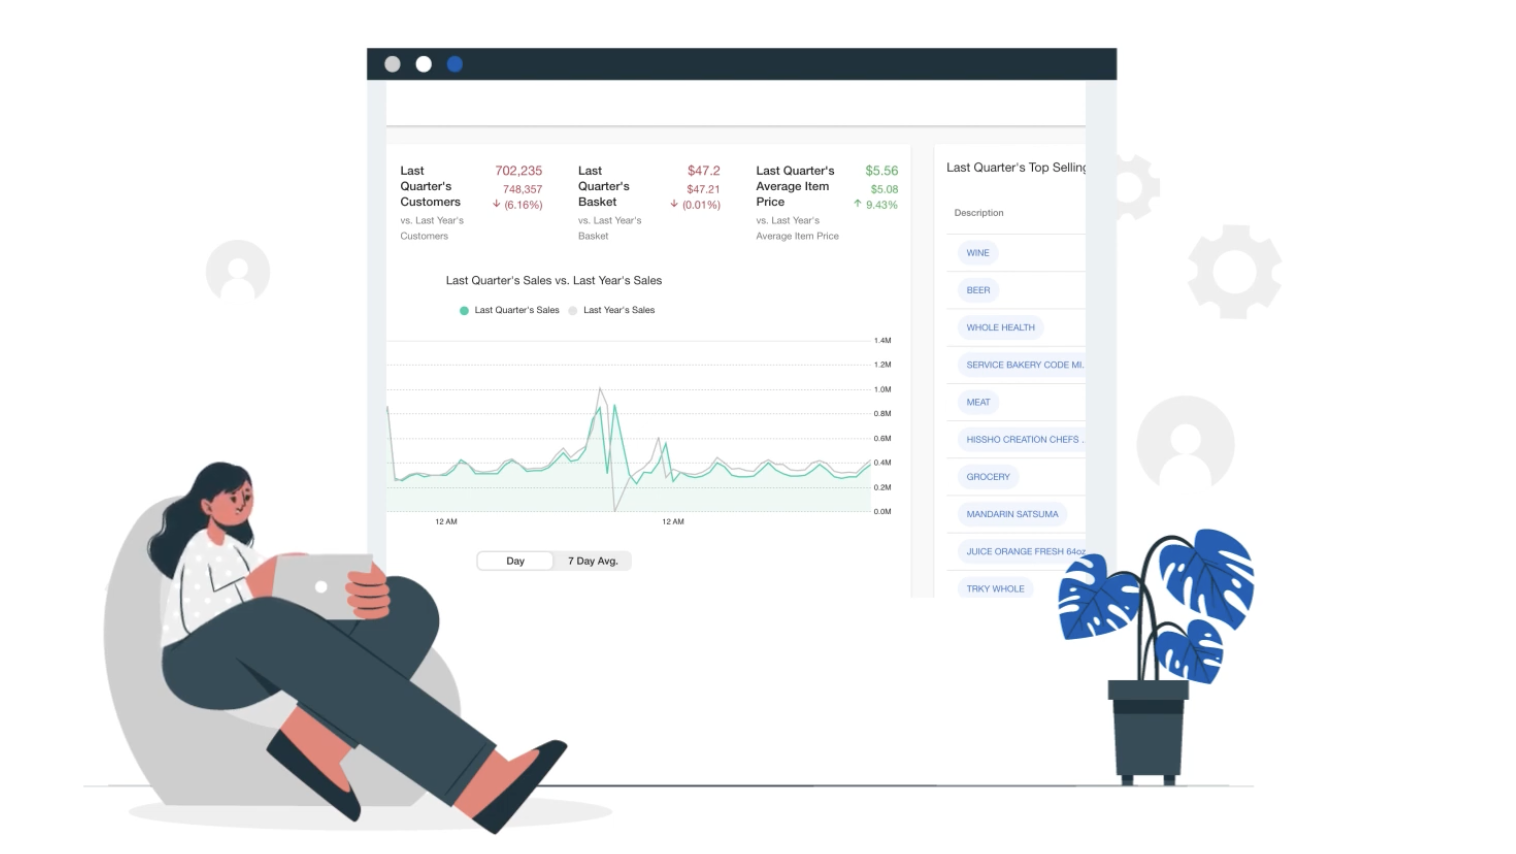
What does it mean for your business: By increasing AOV, you can increase your sales without acquiring new customers. There are several ways to increase AOV, such as upselling, cross-selling, or offering discounts for larger orders. For e-Commerce businesses that rely on data analytics to understand their customers, optimize operations, and drive growth, a data analytics platform such as retailMetrix can help the businesses collect, integrate, and analyze data from various sources and provide valuable insights boosting sales and driving overall business growth.
3. Customer lifetime value (CLV): For retailers, online or otherwise, it is pertinent to truly know your consumers and build a long-term relationship with them. CLV is the amount of money a customer is expected to spend on your business over their lifetime. A study by RJMetrics shows that the average CLV for e-commerce customers is $162. However, the top 10% of customers have a CLV of $1,800 or higher.
3. Customer lifetime value (CLV): For retailers, online or otherwise, it is pertinent to truly know your consumers and build a long-term relationship with them. CLV is the amount of money a customer is expected to spend on your business over their lifetime. A study by RJMetrics shows that the average CLV for e-commerce customers is $162. However, the top 10% of customers have a CLV of $1,800 or higher.
What does it mean for your business: By increasing CLV, you can increase overall revenue and profitability, as well as improve customer loyalty which will build business elasticity over time. As an expanding business, you can offer personalized recommendations, loyalty programs, vouchers for frequent visits, customised and higher quality customer service.
4. Inventory turnover: Overstocking and stockouts can affect your sales negatively, thus, your business should keep track of inventory turnover which measures how quickly you sell your inventory and replenish it. A study by Stitch Labs, the average inventory turnover rate for retailers is 4.3. The top-performing retailers have an inventory turnover rate of 8.2 or higher.
4. Inventory turnover: Overstocking and stockouts can affect your sales negatively, thus, your business should keep track of inventory turnover which measures how quickly you sell your inventory and replenish it. A study by Stitch Labs, the average inventory turnover rate for retailers is 4.3. The top-performing retailers have an inventory turnover rate of 8.2 or higher.
What does it mean for your business: A high inventory turnover indicates that you are selling your products quickly and efficiently, while a low inventory turnover could indicate that you have too much inventory or are not selling products effectively. Based on inventory turnover, your business can priortize the challenges to not selling the products quickly and efficiently. The key thing here is be up to date with the data analysis of the business and focus accordingly.
5. Customer satisfaction: Customer satisfaction measures how happy your customers are with your products or services. Happy and satisfied customers should be a key factor for retailers looking to build a loyal customer base and to increase word-of-mouth marketing. The average customer satisfaction score for e-commerce companies is 86%, according to the research at HubSpot. The top-performing companies have a customer satisfaction score of 90% or higher.
5. Customer satisfaction: Customer satisfaction measures how happy your customers are with your products or services. Happy and satisfied customers should be a key factor for retailers looking to build a loyal customer base and to increase word-of-mouth marketing. The average customer satisfaction score for e-commerce companies is 86%, according to the research at HubSpot. The top-performing companies have a customer satisfaction score of 90% or higher.
What does it mean for your business: A high customer satisfaction score indicates that your customers are happy with your products or services, while a low customer satisfaction score could indicate multiple issues ranging from product quality, customer service, to logistics like shipping. There are many tools, online and otherwise, to help you track customer satisfaction. This can include surveys using SurveyMonkey, Typeform or Google forms (which can also help create Net Promoter Score for the business), tracking social media or using Web Analytics.
"The customer’s perception is your reality!" - Kate Zabriskie
![]()
By tracking these five key metrics, retailers can identify areas for improvement and make important data-driven decisions to boost sales. Whether you are an online or brick-and-mortar retailer, these metrics are essential to the success of your business. If you're looking for tools to help you track these metrics, retailMetrix offers a comprehensive retail analytics platform that can help you make data-driven decisions. To learn more about how retailMetrix can help you boost your sales, check out our website.
Check out our website for more information on how we can help you succeed, and be sure to follow us on social media with the hashtags #RetailAnalytics #DataDrivenDecisions #SupermarketSuccess for the latest industry insights and updates.
%20(1)-1.jpg)
x